Our book is stored in XML DocBook format, which for those of you that have not used it, is ideal for technical books. DocBook contains elements for almost everything you need in a technical book including chapters, sections, paragraphs, figures, glossary terms, bibliographic references, and index terms. In short DocBook is is the perfect fit for most technical books and it can easily be extended. One key aspect about DocBook is that it is easy to transform into multiple formats such as HTML, PDF or ePub. There are many open source transforms available for DocBook. DocBook is at the heart of the movement into single-source publishing for technical publications.
In additional to the standard DocBook transforms we also created a series of reports on the book and I thought they might be of interested to others. Here is a summary of some of these reports.
Chapter length report
When we started writing our book our goal was to produce a 310 page book with 12 chapters, each with approximately equal length. But logically we wanted our fist chapter to be a brief overview and we found that the chapter that described the core NoSQL patterns had more content.This is a horizontal bar chart that shows the length of each chapter. The goal is that all chapters be roughly the same size in length.

Chapter Length Report
The "Naughty words" report
We quickly found out that editors have some words that they don't want to see in a technical book. Words such as "just" or "very" should be used with great caution. There were also words that were not allowed "vs.", "e.g.", "etc.") according to the style guide. This report shows you how often you use these words in each chapter.
Report counting specific words in each chapter
Book metrics report
This is just a raw counts of elements such as book parts, chapters, sections, figures and tables etc.
Book Metrics Report
Chapter metrics report
For each chapter I created a detailed report of the content. As you are writing each chapter, other people can view your progress by running this report. I tend to put in outlines first, then figures and then the actual text of each chapter.List of figures and tables by chapter
These reports shows a listing of figures and tables sorted by chapter and location in each chapter. It also shows the caption for each figure and a thumbnail of the image. There are versions that show the type of figure (line-art vs. bitmapped) the sources of each figure.
List of Figures Report
Figure and table captions reports
Editors want to make sure a book is "browsable" which means that every other page has an interesting figure that people will see when they flip through the book. Each of these reports can list the length of the figures and table captions sorted by the length of the caption. The captions that are too short will need further work.Paragraph and sentence length histogram reports
There are guidelines that should be used when writing technical books on sentence and paragraph length. This report shows the distribution of paragraph lengths in each chapter. You should work with your editor to find reasonable guidelines for your audience.
Paragraph Size Distribution Report
Table of contents reports
For reviewing the book structure it is always nice to have reports that list the book's structure by chapter, section, sub-section and sub-sub-section. These reports come with several parameters that limit the depth of the table of content and can also be modified to create mind maps using open source mind mapping tools.
Table of contents showing Parts, Chapters, Section 1 and Section 2
Once I wrote the basic structure of the table-of-contents report it was easy to create other output formats for different functions. Here is an example of a GraphViz output.

Book Outline using GraphViz format.
This example used the DOTML markup format and an external transform using the Chris Wallace graphviz XQuery module.
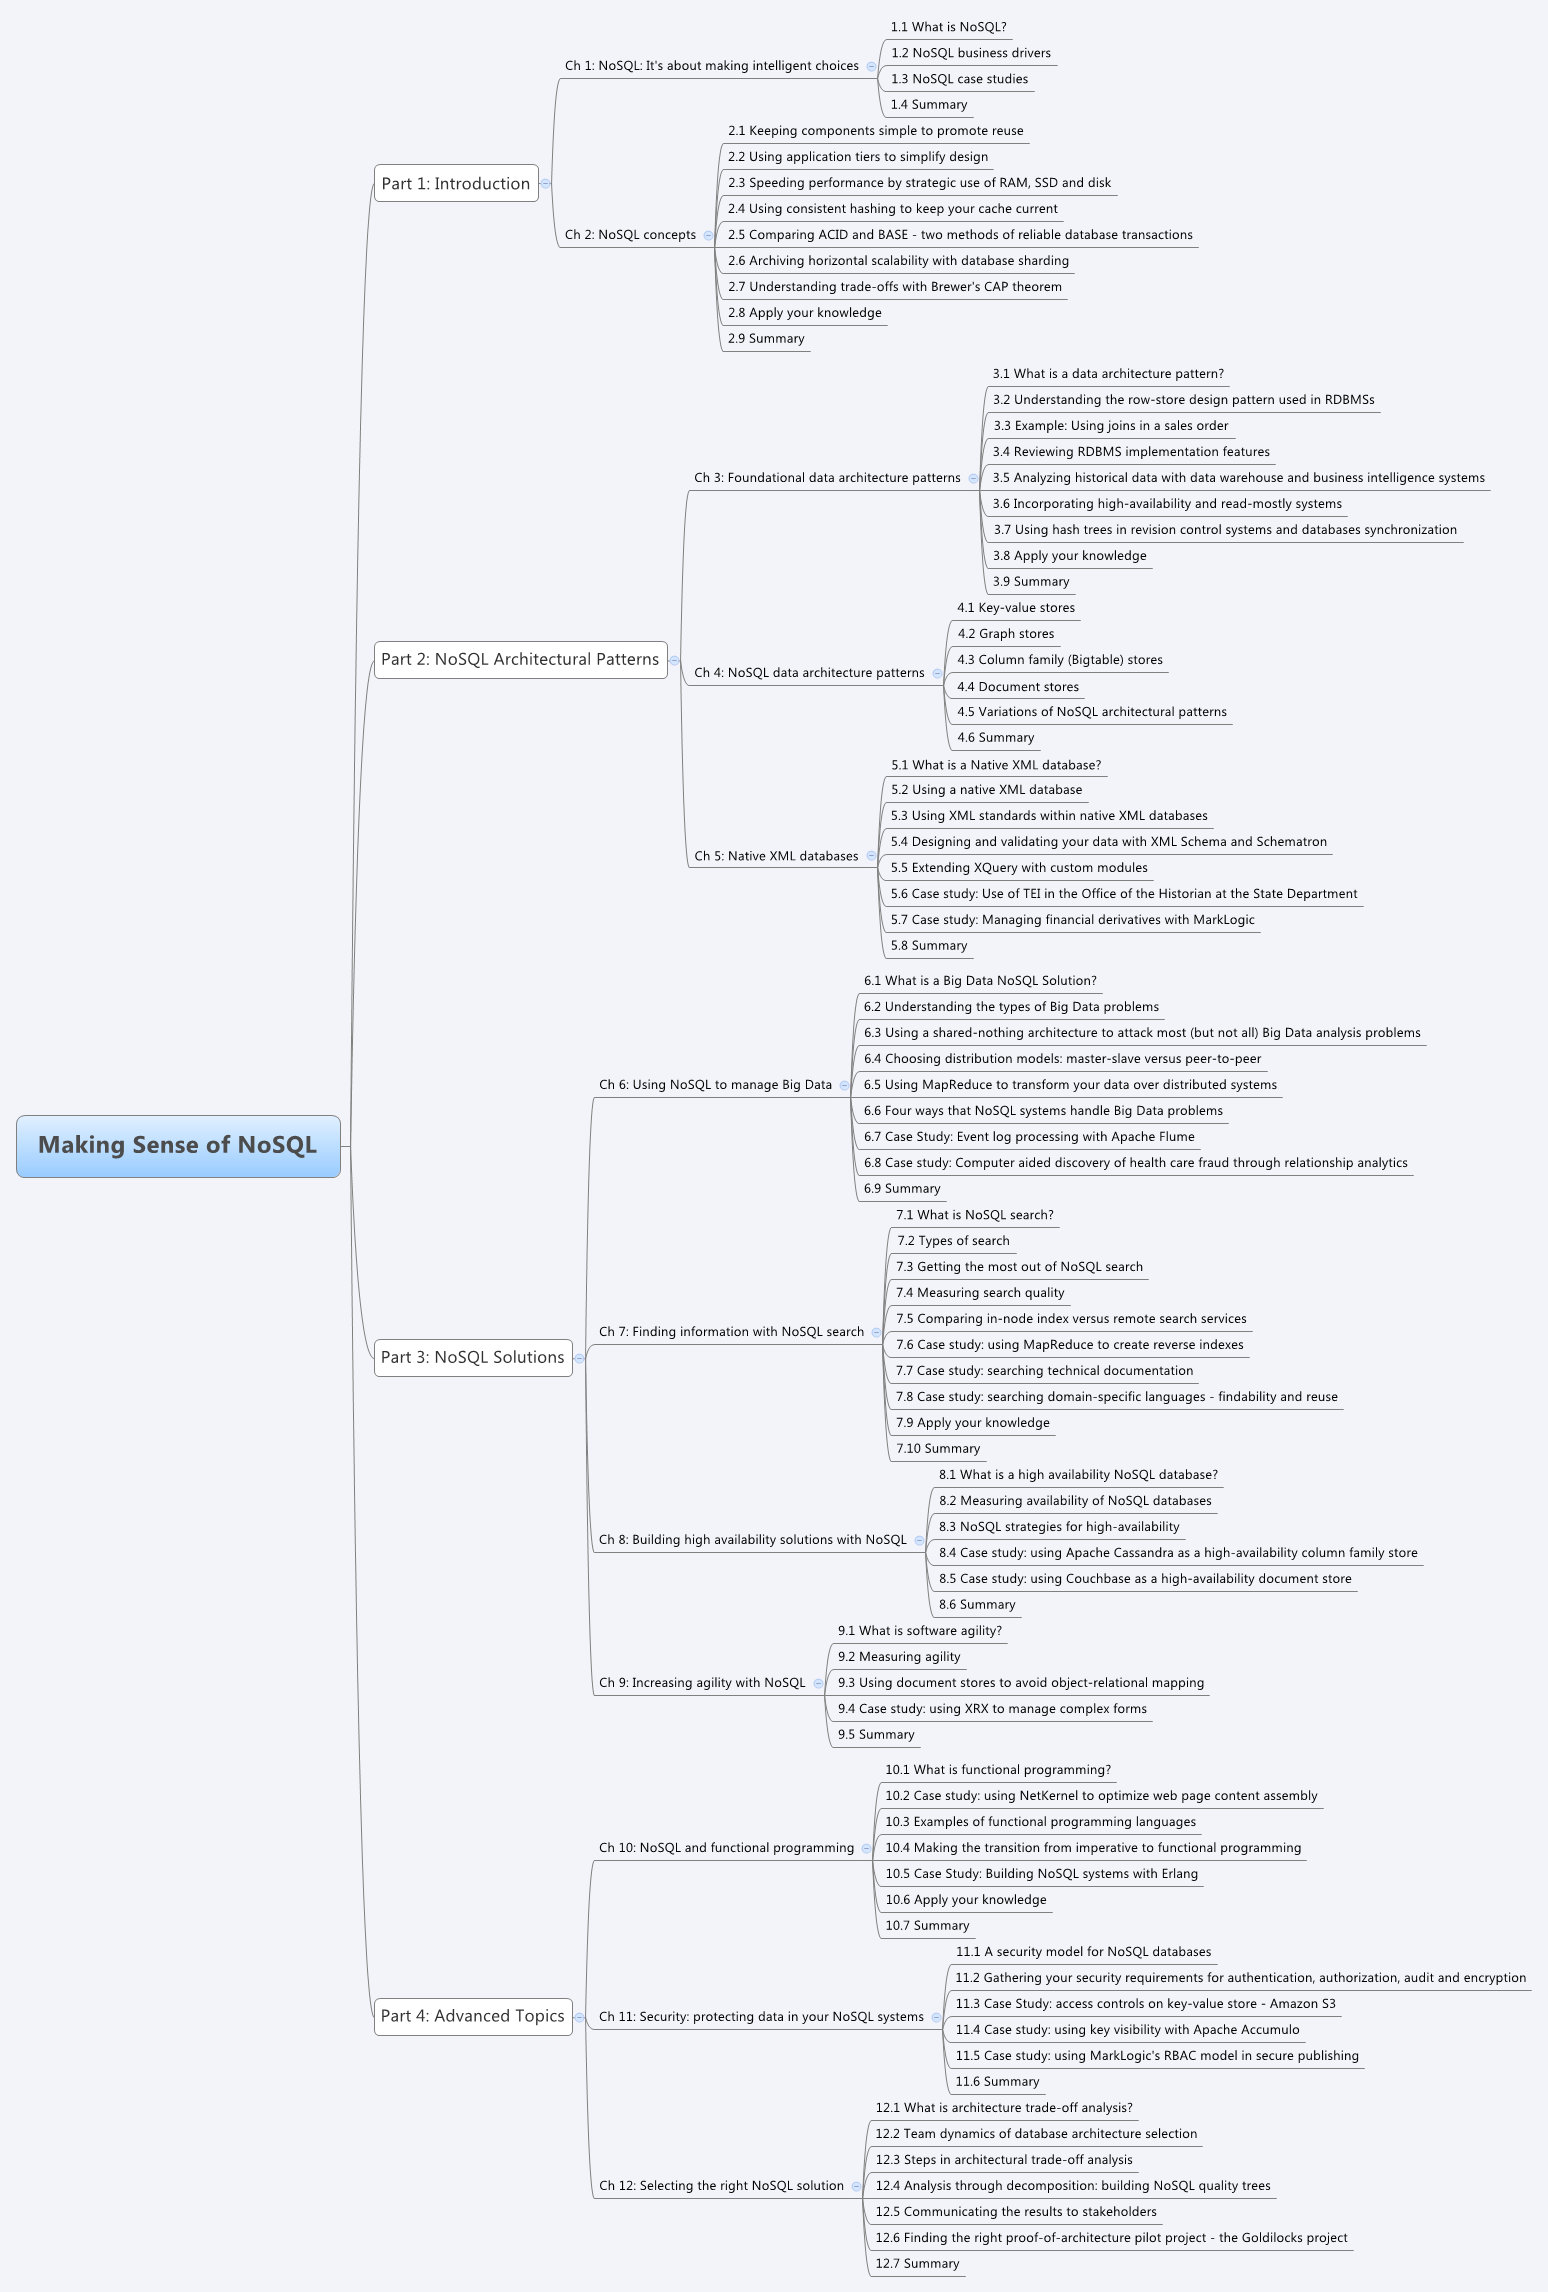
You can also convert the table of contents into an Mindmap file and open the file in FreeMind or XMind.
Here is an example of the book rendered in XMind. NoSQL Book MindMap
Glossary of terms reports
Our book puts a focus on the terminology used in the NoSQL movement. We try to create precise definitions of all the terms we use and discuss the variations in definitions in different NoSQL communities. I use these reports to list each time a term is first introduced and make sure that we have a formal definition in the Glossary Appendix at the end of the book.
Glossary Term Report Showing Glossterm IDs and Definition Status
There are also other miscellaneous reports listing the introductory chapter quotes, lists of comments by reviewer (extracted from PDF using Apache Tika), and various tools to help us gauge the completeness of each chapter.
Report Strategy
We created a central XQuery book module that had all the common functions such as $book:chapters, or that returned a sequence of all book chapters or book:word-count($node) that returned a word count of a node. I used the eXist-db database to store and execute the transforms. After we created the module the templates could be quickly customized for each report. We also used the oXygen XML IDE extensively and we want to thank George Bina for his support of our project.I think that DocBook, oXygen, XQuery and eXist are ideal tools for managing the book creation process.
1 comment:
This is all very interesting, especially since I am just trying to write a book myself. Thanks for sharing!
Post a Comment